Introduction
In software engineering and business process modeling, activity diagrams serve as a valuable tool to represent workflows. They are part of the Unified Modeling Language (UML) and illustrate the flow of control or data from one activity to another. Unlike traditional flowcharts, activity diagrams support concurrency, choice, and iteration, making them ideal for modeling both simple and complex processes.
Think of activity diagrams as a hybrid between flowcharts and data flow diagrams, providing structure while capturing dynamic behavior. Below, we’ll explore the essential components that make up an activity diagram.
Key Components of an Activity Diagram
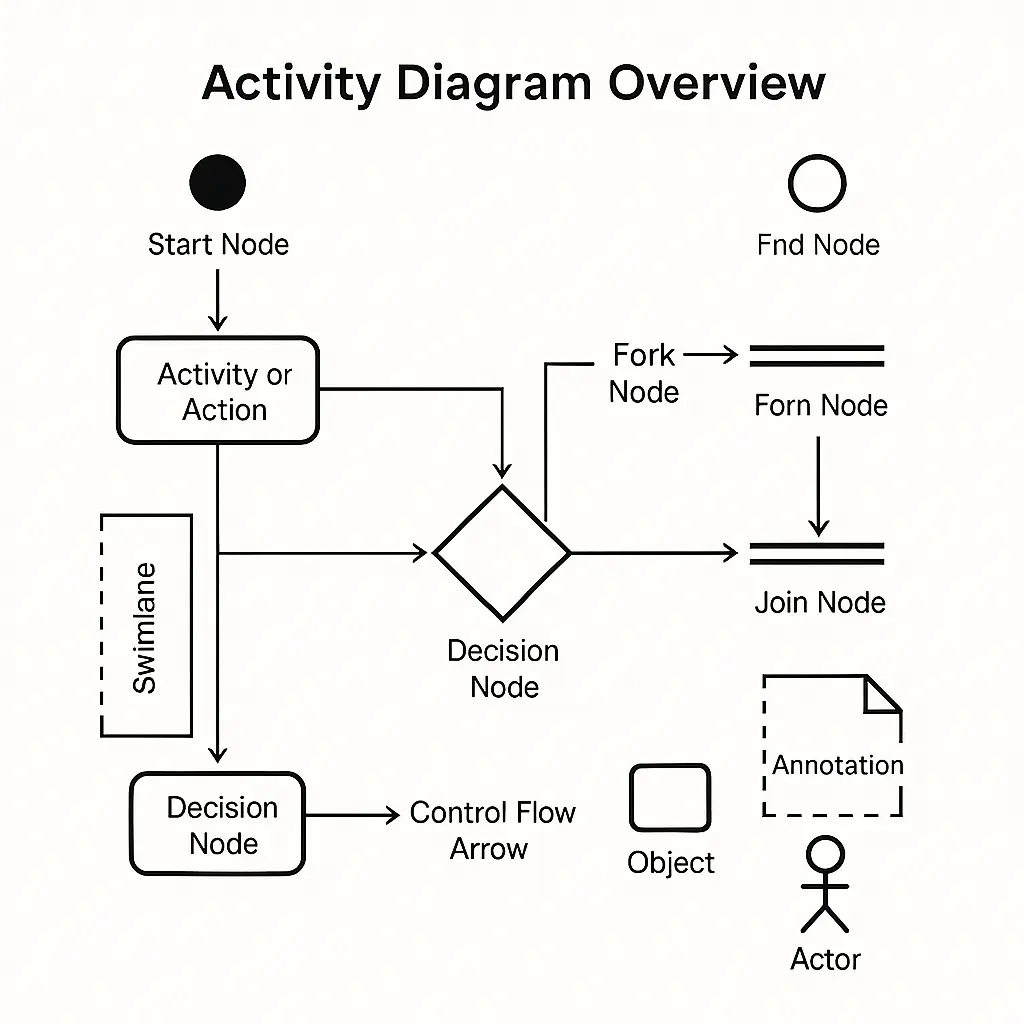
1. Start and End Nodes
- Start Node: Denoted by a filled circle, it marks the beginning of a process.
- End Node: Represented by a circle with a border or a filled circle inside a ring, it signifies the completion of the process.
2. Activities (or Actions)
- Represented by rectangles with rounded corners.
- Each activity represents a specific task, step, or action performed within the process.
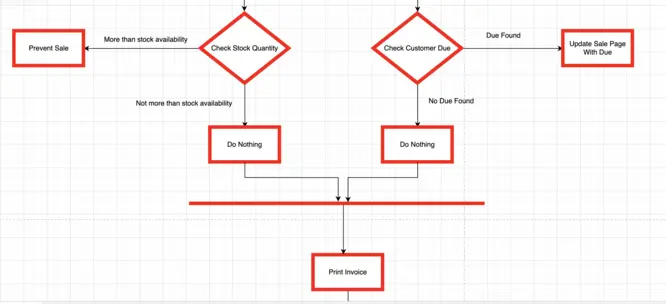
3. Decision Nodes
- Shaped like a diamond.
- These nodes indicate points where a decision is made based on conditions.
- Each outgoing arrow from a decision node represents a possible outcome or path.
4. Control Flows
- Arrows connecting different elements in the diagram.
- They indicate the sequence or flow of execution between actions, decisions, or other nodes.
5. Fork and Join Nodes
- Fork Node: Splits one flow into multiple concurrent flows. Represented by a thick horizontal or vertical bar.
- Join Node: Merges multiple concurrent flows into a single path. Also shown as a bar.
6. Swimlanes
- Vertical or horizontal partitions that organize actions based on the participants (e.g., roles, departments).
- Swimlanes help clarify which part of the system or which actor is responsible for each activity.
7. Annotations and Notes
- Optional elements used to provide additional context or explanations.
- Usually represented as a rectangle with a folded corner and connected with a dashed line.
8. Objects and Actors
- Objects: Represent entities or instances involved in the workflow.
- Actors: External participants or users interacting with the system. Typically depicted as stick figures.
Example Use Case: User Login Process
Here’s how these components can come together in a simple use case:
-
Start Node
-
Activity: User enters login credentials
-
Decision Node: Are credentials valid?
- If Yes: Proceed to user dashboard
- If No: Display error message and prompt again
-
End Node
Fork and Join nodes could be added if, for example, the system logs user activity and loads personalized content concurrently.
Conclusion
Activity diagrams are a powerful way to visualize and understand workflows in both software and business systems. They offer clarity in documenting processes and are especially useful in system design, process optimization, and requirement gathering. By mastering activity diagrams, teams can improve communication and streamline development processes.